
Building an Interactive Tool:
Sea Level Rise
This project demonstrates the process of creating an interactive tool in ArcGIS Model Builder. The report includes a screenshot of the sea level rise calculator to show the use of a digital elevation raster layer and raster calculator to compute the change in sea level. The raster was converted to a polygon to make the feature layers before applying the clip and buffer tools to obtain the results.

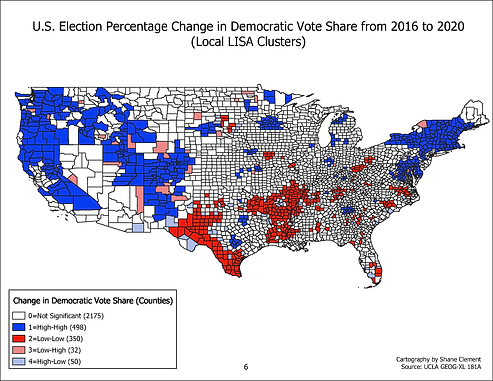
2016 and 2020 U.S. Presidential Election Voter Behavior
This project contains socioeconomic demographics and election result data to analyze voter trends and test the hypothesis that geographical location influences election outcomes. Global Moran's I, local indicators of spatial autocorrelation (LISA), and directional LISA were used to show the variables' spatial distribution, statistical significance, and spatial dynamics.
Estimated Average High Temperatures for January and August
This project compares the average high temperatures for medium to large cities in California during January and August using Kriging and Inverse Distant Weighted Interpolation (IDW). The Kriging method provided more accurate results than the IDW method in showing the climate differences between the coastal and desert regions. However, additional methods should be considered to ensure the accuracy of the Kriging interpolation results.
